See
Compare fairly, with numbers instead of gut feeling.
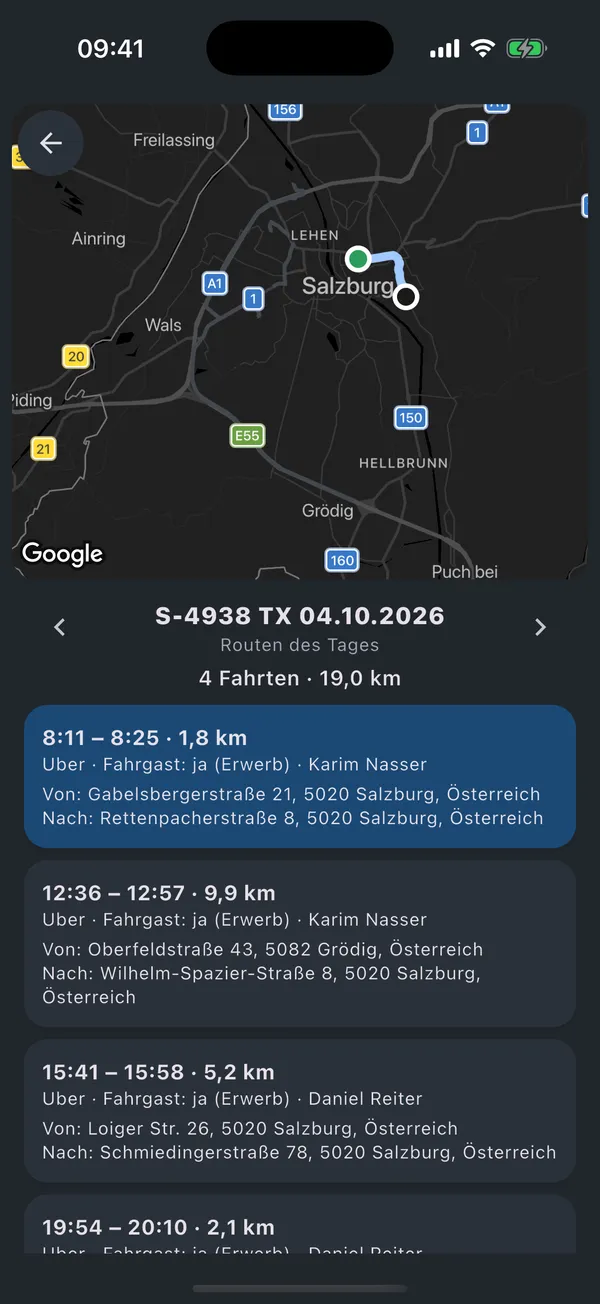
No pillory, a day sheet. The same numbers for driver and boss, so the conversation is about facts.
The problem
- One drives a lot, the other drives well. Who is better for the business?
- A driver brakes hard and wears out the clutch. You notice it on the workshop bill.
- Conversations with drivers turn into accusations because evidence is missing.
How it works
- 01
A day sheet every night
At half past three the previous day is created for every driver: kilometres, paid kilometres, utilisation, hours, estimated revenue, harsh events, crash alerts.
- 02
One score, traceable
Safety counts 35 percent (target: at most five harsh events per 100 kilometres), productivity 30 (target: 60 percent utilisation, 30 euros per hour), regularity 15. Only from 20 kilometres is there a statement.
- 03
Driving style, where the car measures it
Where the device calculates a driving style value, it is shown: calm from 9.0, brisk from 7.0, below that harsh.
What it does not do
- Punctuality (20 percent of the score) is empty today, because there is no shift data yet.
- The driving style value only comes from devices that calculate it; measured on one of three vehicles.
- Revenue is estimated from the tariff, not from the till.
Questions
Does the driver see their score?
Yes, in the driver app everybody sees their own day. The company sees all.
Can I compare drivers in groups?
Driver groups exist, such as early shift; they also control call distribution.
Is this fair to night drivers?
Utilisation and revenue per hour apply equally to all; harsh events are counted per 100 kilometres, not in absolute terms.
Let us show you on your own cars.
Half an hour, no obligation. You see the app with real data and get a quote for your fleet.